ES
ES RU
RU DE
DE PL
PL IT
IT TR
TR FR
FR BR
BR NL
NL CN
CN CZ
CZ UA
UA HU
HU SE
SECircle Infographic Templates Design Layout
![]() Sales:
Sales:
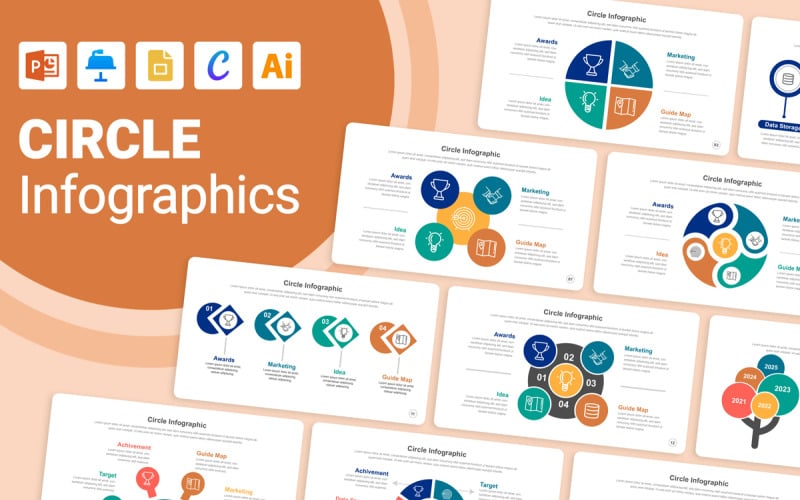

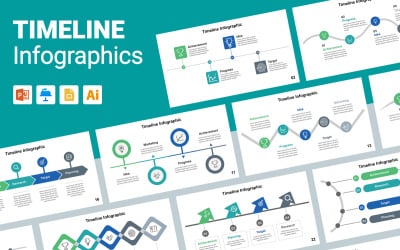
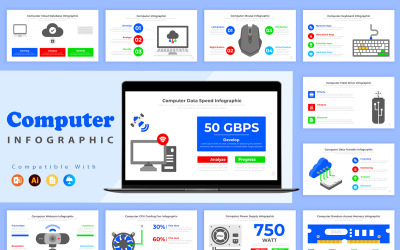
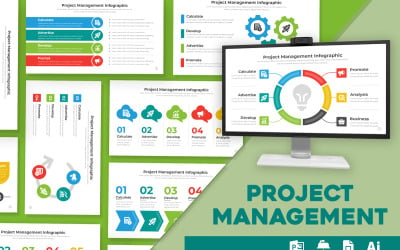
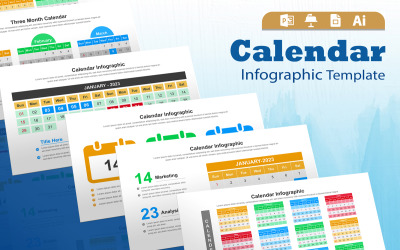
Make your presentations pop with our eye-catching Circle Infographic Templates. These professionally designed templates allow you to showcase your key data and statistics in an engaging circular format that grabs attention. These circle infographics are fully editable and compatible with top applications like PowerPoint, Google Slide, Apple Keynote, Canva, and Illustrator. It’s easy to customize the designs and text elements to highlight your most valuable insights.
Upgrade your next presentation and let these infographic templates do the hard design work for you. Download These Circle Infographics now to create an impressive and intuitive presentation that resonates with your audience.
- What are Circle Infographics?
Circle infographics, or radial infographics, are creative ways to visualize data and statistics in an eye-catching circular layout. These eye-catching circular layouts showcase statistics, facts, and figures in an intuitive and engaging format. But circle infographics aren’t just decorative – they also improve comprehension and memorability compared to standard data visualizations.
In a circle infographic, information is arranged radially, with your key data point or most important statistic in the center. Additional information radiates outward from the central focal point in segments around the circle. This format/style allows you to display multiple metrics in context with each other so viewers can easily see the relationships between data.
- Different Style Circle Infographics Examples
We have different Circle infographics that come in many styles and formats to suit your needs and niche. You can personalize visual aspects such as color, fonts, icons, and others to align with your brand image or presentation concept. Choose from single, double, or multiple circle layouts depending on the amount of data you want to highlight. These infographics are available in widescreen 16:9 ratio and can be customized on Microsoft PowerPoint, Google Slide, Apple Keynote, Canva, and Adobe Illustrator.
▶ F E A T U R E
================
✔ Instant Download – your files are available immediately after purchase
✔ Professional, clean design
✔ Easy to edit in PowerPoint (PPT), Apple Keynote File, Google Slides, Illustrator (EPS) File,
✔ 100% Editable
✔ Using a free font
▶ W H A T ' S I N S I D E
===========================
✔ PowerPoint (PPT) File
✔ Apple Keynote File
✔ Google Slides
✔ Illustrator (EPS)
✔ Help File Documentation
✔ Links to free fonts used
✔ Fast and friendly customer service for any help you may need
▶ S U P P O R T
================
For any help regarding this file, please feel free to contact me and I’ll be glad to offer support. If you have a moment, please rate this item, I’ll appreciate it very much! Please don’t underestimate the power of the stars.
THANK YOU.
0 Reviews for this product
0 Comments for this product
Related Topics:
Tags:
Images included:
Requirements for software and hosting:
 Adobe Illustrator 8+
Adobe Illustrator CS2
Adobe Illustrator 8+
Adobe Illustrator CS2  PowerPoint 2003 or 2007 (better)